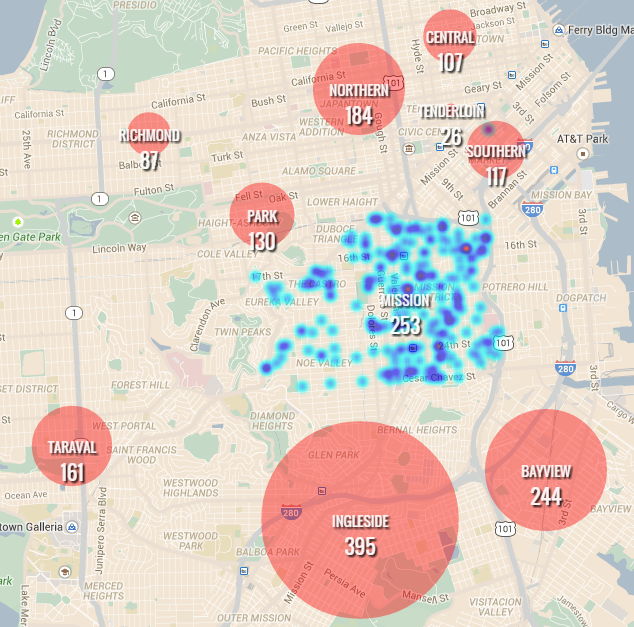
This was a personal project to experiment using dataset processed with R Studio of vehicle thefts in SF and plotting with Google Maps JS API. I enjoyed exploring what Google Maps had to offer through heatmap visualizations and styling the map layouts themselves to suit time of day as well as rendering different views based on the level of zoom to maintain relevancy of information presented.
Read Full Blog Post